


Biden Grows National Debt Per Household by 11% in Two Years
After two years in power, President Joe Biden doesn’t have many positive accomplishments to brag about.
That may be why the President has made so many “false and misleading” claims in recent economic speeches.
But while his economic legacy is not shaping up to be a good one, he has given Americans one enduring legacy. He’s grown the U.S. national debt per household by 11% in the two years he has occupied the Oval Office. That is really saying something because the national debt was already $27.75 Trillion on the day he was sworn in.
The financial analysis blog Political Calculations puts the growth of the national debt during the Biden era into easier-to-grasp terms.
Friday, 20 January 2023 marked the second anniversary of President Biden’s tenure in the White House. On that day, the U.S. government’s total public debt outstanding reached $31,454,980,005,742.40. The only reason it isn’t higher is because the U.S. Treasury Department hit the nation’s statutory debt ceiling the day before.
But that’s not the real story. The more important story is the growth of the U.S. national debt during the last two years. That debt has increased by $3,695,343,467,324.62 since 20 January 2021.
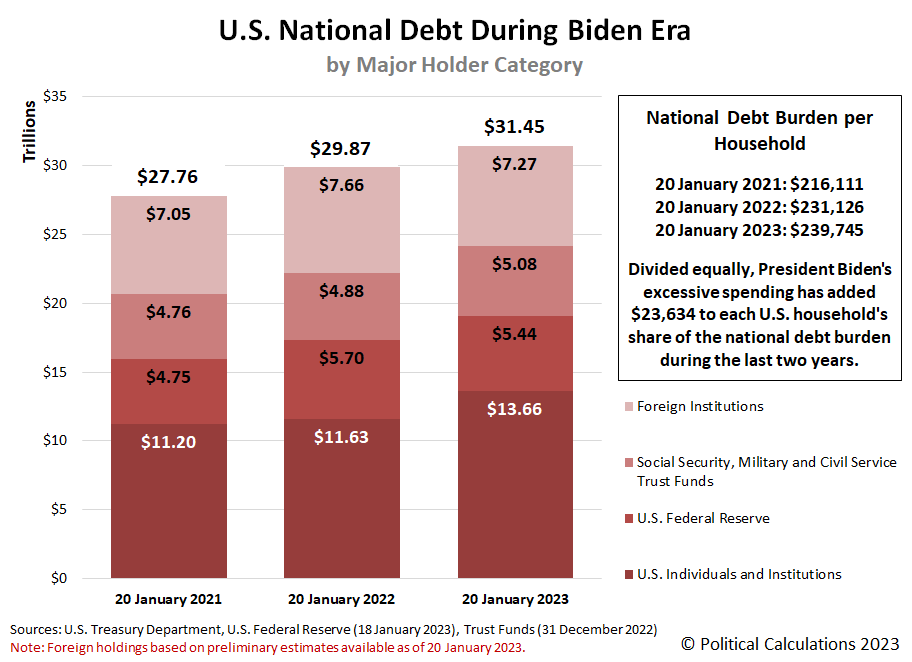
Large numbers like that can be difficult to grasp, so let’s bring them down to a more human scale. If you divided the U.S. government’s total public debt outstanding equally among every household in the U.S. two years ago, each would be responsible for paying the U.S. government’s creditors $216,111. Two years later, the national debt burden per household has grown to $239,745. The increase per household is $23,634, or 10.9%, which of course, would be on top of whatever other debt each household has.
That increase is the equivalent of buying 131,202,000 American households a brand new 2023 Suburu Impreza! More on that metaphor in a bit....
We’ve visualized the growth of the U.S. national debt during the Biden era in the following chart. In the chart, we’ve also identified the U.S. government’s creditors by major category:
Here’s the big question. Would American households be better off if President Biden actually did buy each a brand new Suburu Impreza instead of what he actually bought with all that newly borrowed money?
Or rather, did Americans get anything of real value to show from President Biden’s debt-fueled spending and what it has wrought?
President Biden’s economic legacy isn’t just the public debt he’s leaving behind. It’s also the inflation his policies and debt-fueled spending have created. No wonder he’s running around making so many false and misleading claims!
- This article was updated on 3/10/2023. The Political Calculations blog made several corrections to their article (see below), but this revised article still shows their original values and chart since none of the values changed by a meaningful percentage.
- The national debt increased by $3,703,083,769,327.63 during President Biden’s first two years in office instead of $3,695,343,467,324.62. This error is the result of math that used the U.S. government’s total public debt outstanding on January 22, 2021 instead of January 20, 2021.
- Each household’s share of the U.S. national debt on January 20, 2021 was $216,051 instead of $216,111.
- The increase of national debt per household during President Biden’s first two years is $23,694 instead of $23,634. That is a percentage increase of 11.0% instead of 10.9%.
- The chart has been updated with the corrected values.


