


Regime Uncertainty: Are Interest-Rate Movements Consistent with the Hypothesis?
Regime uncertainty has gained increasing recognition as the current economic troubles have persisted with little or no improvement since the economy reached a cyclical trough early in 2009. As described in my 1997 paper, regime uncertainty pertains to
the likelihood that investors’ private property rights in their capital and the income it yields will be attenuated further by government action. Such attenuations can arise from many sources, ranging from simple tax-rate increases, to the imposition of new kinds of taxes, to outright confiscation of private property. Many intermediate threats can arise from various sorts of regulation, for instance, of securities markets, labor markets, and product markets. In any event, the security of private property rights rests not so much on the letter of the law as on the character of the government that enforces, or threatens, presumptive rights.
In the latter half of the 1930s, many investors feared that the government would destroy the private enterprise system and replace it with fascism, socialism, or some other extreme transformation of the existing economic order.
In testing my hypothesis, I marshaled three distinct types of evidence: historical documentation of government actions and public reactions; findings of public opinion surveys, especially surveys of businessmen; and evidence from financial markets. The latter seems to some observers, especially to economists, to be the most telling because it is relatively “hard” and quantitative. In any event, it is the sort of evidence economists are accustomed to analyzing.
My most striking financial evidence for the New Deal episode pertains to the yield curve for corporate bonds, that is, to the spreads between the effective yields on high-grade corporate bonds with various terms to maturity. I found that this yield curve became suddenly much steeper sometime between the first quarter of 1934 and the first quarter of 1935 (a period when the New Deal lurched from its first, or business tolerant, phase to its second, or business hostile, phase) and remained very steep until sometime between the first quarter of 1941 and the first quarter of 1942 (a period when the New Deal handed over the reins to the military and the big businessmen who, along with the president himself, ran the war-command economy for the duration). I interpreted these extreme spreads as risk premiums on longer-term investments caused by regime uncertainty.
Given the extraordinary scale and scope of the actions the government has taken since mid-2008 and the many expressions of uncertainty (and hence of unwillingness to undertake long-term investments) voiced by businessmen and others as a result of this flurry—bailouts, unprecedented monetary policies, surges in government spending, and tremendous regulatory undertakings in health care and financial markets, among other things— one wonders whether the corporate bond yield curve shows the same kind of movement it displayed in the face of the regime uncertainty that prevailed from 1935 to 1941.
To pursue this matter, I have examined a number of series on corporate bond yields, by term to maturity, that I constructed from data available at Bondsonline.com. (Normally, when economists analyze “the yield curve,” they use data on U.S. Treasury securities. I caution against using such data for the purpose under discussion here. To analyze risks to private property rights as manifested by the risk premiums in bond yields, one must use private bonds, not government bonds.)
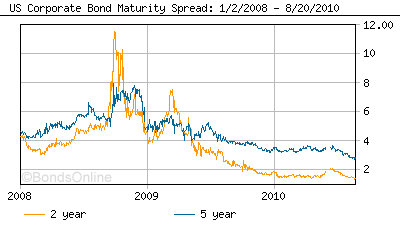
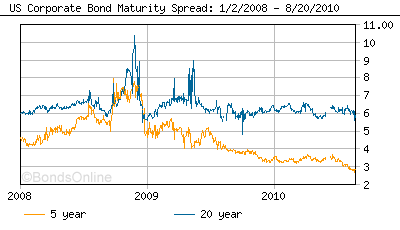
I find that back in 2008, before the onset of the financial panic in September, the corporate bond yield curve was rather flat – that is, the yields increased only slightly with term to maturity. At the lower end of the yield curve, yield spreads were tending to narrow slightly until late September. When the panic hit, yields became extremely volatile, especially for the bonds with 2 years to maturity (the shortest term in the data), and remained volatile for almost a year. After mid-2009, the volatility diminished greatly.
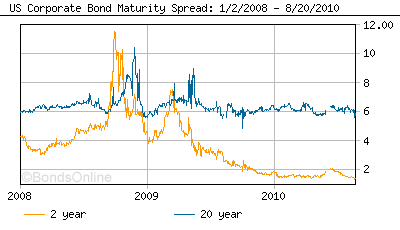
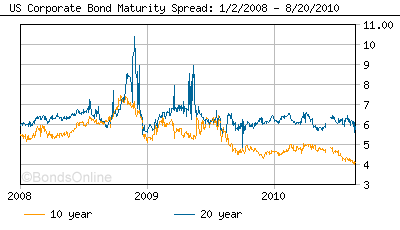
Examining these data, I find that once this dust had settled, the yield curve for corporate bonds had become substantially steeper. For example, the spread between corporate bonds with 5 years to maturity and corporate bonds with 2 years to maturity increased from roughly 1 percentage point or less before the financial crisis to roughly 2 percentage points since mid-2009. Similar changes occurred in the spread between the bonds with 10 years to maturity or 20 years to maturity and the bonds with 2 years to maturity: the former increased from roughly 1 percentage point to 2-3 percentage points; the latter increased from roughly 2 percentage points to roughly 4 percentage points or more.
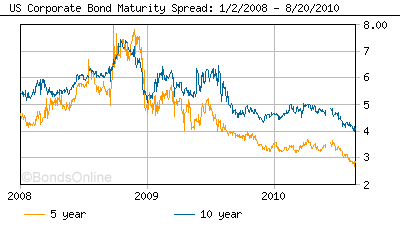
Similarly, at the upper end of the yield curve, the spreads widened: between the bonds with 10 years to maturity and those with 5 years to maturity, from roughly a fraction of 1 percentage point to roughly more than 1 percentage point; between bonds with 20 years to maturity and those with 5 years to maturity from roughly 1 percentage point or less to 2-3 percentage points. Finally, the spread between the bonds with 20 years to maturity and those with 10 years to maturity increased from less than 1 percentage point before the crisis to 1-2 percentage points since mid-2009.
Thus, corporate bond yields have exhibited three distinct periods: pre-crisis stability with a shallow yield curve; extreme volatility of the yield curve, including some inversions in the latter part of 2008; and post-crisis stability with a much steeper yield curve since mid-2009.
Thus, just as the steep yield curve for the New Deal years corresponds precisely with the so-called Second New Deal, when Roosevelt and his leading subordinates and advisers went on the warpath against investors as a class, the recent transition corresponds to the volatility associated with the period of frenetic government action and financial market fluctuations between September 2008 and the middle of 2009, leaving in its wake a much steeper yield curve.
I view these financial data as consistent with the hypothesis of recently heightened regime uncertainty. Of course, they do not “prove” that it is true, just as the striking data I found for the 1930s do not “prove” the hypothesis as applied to that episode. But in economic history, one looks above all for the correspondence of various forms of evidence with the interpretation one places on the observations. In the current episode, as during that of the latter 1930s, we find that (1) a great deal of direct testimony by businessmen and investors, (2) an account of the government’s ideological character and the historical narrative of what the government has done and, and (3) the bond-market evidence (as well as the movements of the stock market, although they are more difficult to interpret) all conform with a hypothesis that places significant weight on regime uncertainty.
In any event, these preliminary explorations certainly show that the hypothesis should not be dismissed out of hand because it is not “scientific” or because it is not part of the mainstream macroeconomist’s customary style of mathematical modeling. If mainstream analysts continue to disregard the role of regime uncertainty in the major depressions of the modern era, especially in accounting for their extraordinary duration, then they will only demonstrate the poverty of their own mode of analysis.
The following graphs show the data on yield spreads that I have discussed above.