


Why Is the National Debt So Big?
How did the national debt become such a huge problem? Two things primarily drive the size of the national debt. The amount of revenue the federal government takes in through its tax collections and how much it spends. Of those two things, which do you think is most responsible for running up the size of the national debt? Is it a shortfall of tax revenue?
Or is it excessive spending?
Economist Brian Wesbury answered those questions with a single tweet in responding to claims made by what he calls the “talking point” crowd:
The “talking point” crowd is blaming the Trump tax cuts on the deficit. This is ridiculous. Here are charts of both spending and revenues. Tax cuts barely changed revenues. But, in spite of the end of COVID, spending remains way above trend. Massive spending = Massive deficits. pic.twitter.com/tte8c9lnwA
— Brian Wesbury (@wesbury) March 11, 2024
His charts provide supporting evidence that the U.S. government’s above-trend spending is mostly responsible. They show that the federal government’s receipts and spending are both running above their trends over time, with spending running way over its trend in recent years.
More evidence needed
While these charts are fine for showing how the U.S. government’s revenues and expenditures compare with their respective growth trends, they do have limits. What they don’t show very well is how they compare with each other. Expenditures are larger than revenues, which is why the vertical scale on that chart differs from the revenue chart scale. They also don’t go back far enough in time.
I compiled a different chart using data from the historical tables for President Biden’s FY2025 budget proposal. In the chart, the annual data for revenues and spending has been benchmarked with respect to the size of the U.S. economy and is stated as a percent of GDP for the U.S. government’s fiscal years from 1948 through 2023.
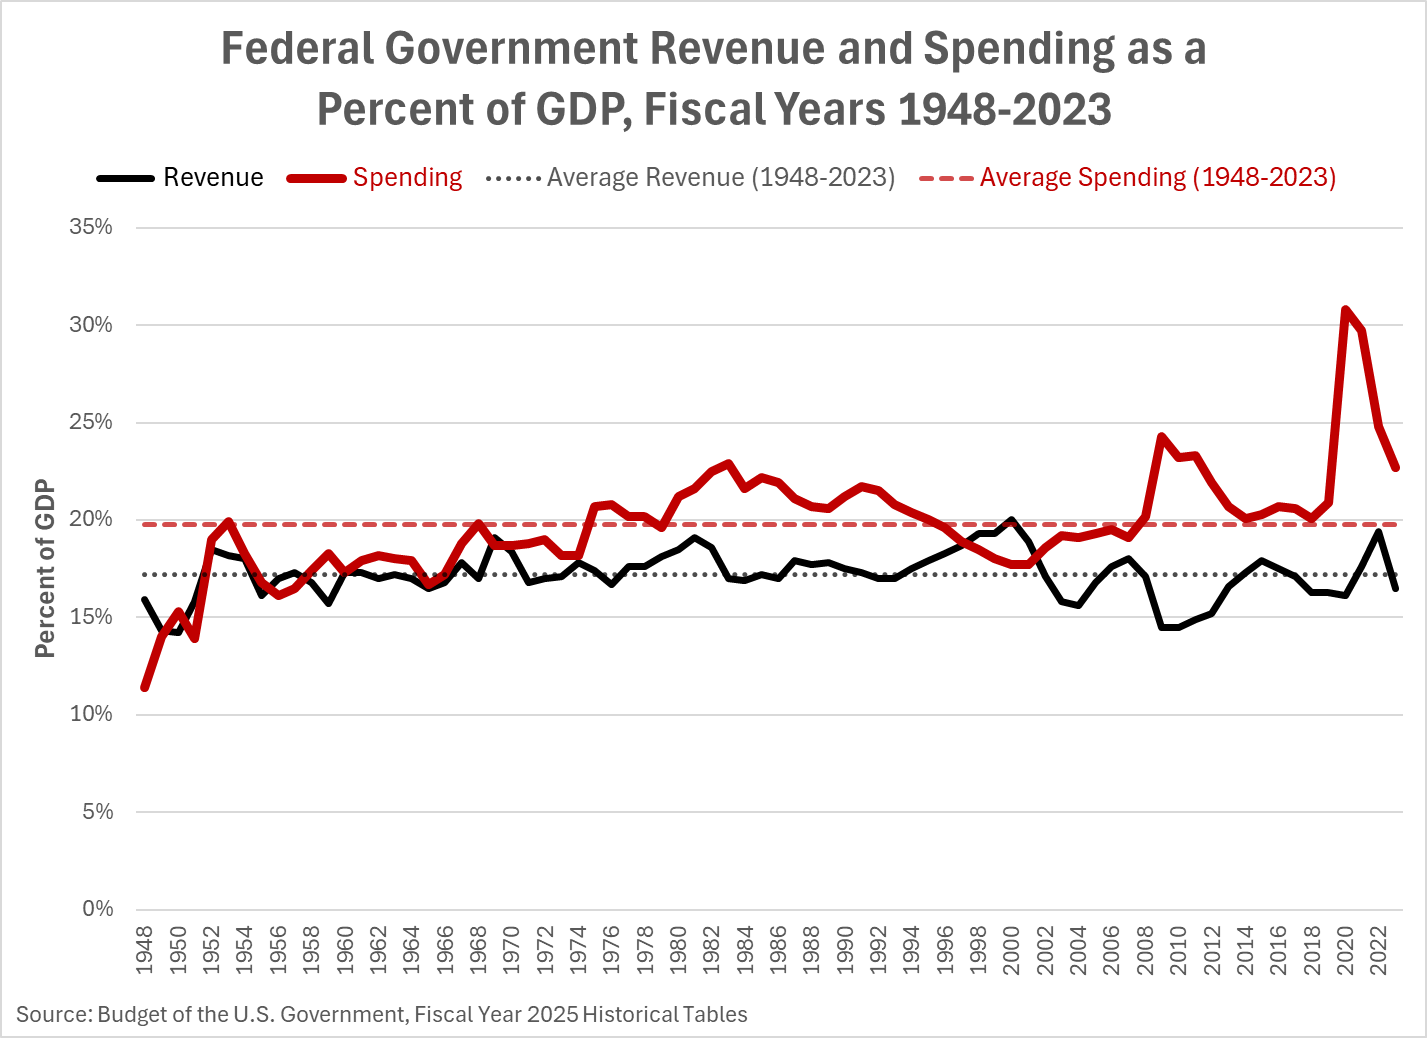
From 1948 through 2023, the U.S. government’s revenue averaged 17.2% of GDP, and its spending averaged 19.8%. Compared with these averages, it quickly becomes evident that excessive spending is a chronic problem for the U.S. government.
While the problem dates back to the mid-1960s, it shifted for the worse in the mid-1970s. It has become a much bigger problem since 2000, especially during the Great Recession and the pandemic. Though the pandemic was declared to be over early in 2023, spending remains far above its long-term trend. It continues to be the major driver forcing the growth of the national debt upward.
Economist Scott Grannis arrives at a similar conclusion after doing a similar analysis:
Chart #10 puts federal spending and revenues into an appropriate context, by comparing them to nominal GDP. Here we see that the growth of spending and revenues has largely tracked the growth of nominal GDP. Spending today is significantly higher than its post-war average, while revenues are only marginally lower. Spending is what’s driving deficits, not a lack of revenues.
If President Biden’s proposed FY 2025 passes, the federal government’s excessive spending will continue running up the national debt for years to come. The problems it poses will only get bigger.


