


The Growth of the National Debt Under President Biden
The U.S. national debt grew by $2.11 trillion during President Biden’s first year in office. The U.S. government’s total public debt outstanding has ballooned to $29.87 trillion at Biden’s anniversary mark. Split between the country’s 129,931,000 households, that’s about $229,891 per American household.
But who does the U.S. government owe all that money to? How much of the growth of the national debt is because of the Biden-Harris administration’s policies?
Political Calculations provides the analysis to answer both these questions:
When Joe Biden was sworn in as President of the United States on 20 January 2021, the U.S. national debt stood at $27.76 trillion. One year later, the total public debt outstanding of the U.S. government has ballooned by nearly $2.11 trillion (or 7.6%) to $29.87 trillion.
Perhaps a better question to ask is to whom does the U.S. government borrow owe all the money it has borrowed?
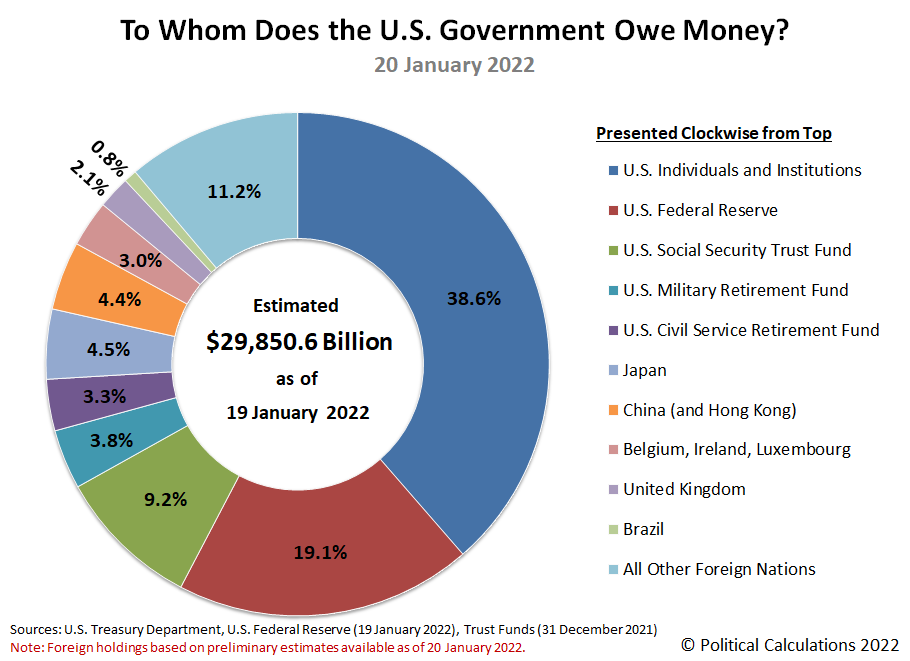
The following chart illustrates who the U.S. government’s biggest creditors are as of the end of President Biden’s first year in office along with the portion of the national debt they are owed.
The Overall Picture
The U.S. Federal Reserve is once again Uncle Sam’s single largest creditor, accounting for 19.1% of the entire U.S. government’s national debt. The Fed’s share of the total public debt outstanding has grown from 16.5% a year earlier.
By contrast, the U.S. government’s second largest creditor is Social Security, whose share of the ownership of the national debt dropped from 10.4% of the total to 9.2%. Social Security has been running in the red since 2009, forcing its Old Age and Survivors’ Insurance Trust Fund to sell off U.S. treasuries it accumulated when it was operating in the black in order to keep paying out benefits at promised levels. Social Security’s share of the U.S. national debt is projected to decline to 0% in 2034. After that happens, Social Security benefits will be reduced by somewhere between 20-25% as promised under current law.
The retirement trust funds for the U.S. government’s military and civilian employees together account for 7.1% of the total U.S. national debt. After these large holdings, a diverse range of U.S. institutions, such as banks, insurance companies, independent corporations, investment firms and individuals combine to hold the largest share of money owed by the U.S. government, accounting for 38.6% of the total, down from the 40.4% share they held a year ago.
Foreign entities combine to account for holding 25.9% of the total debt liabilities issued by the U.S. government, up from the share of 25.4% they held on 20 January 2021. Of the portion of the national debt owed to foreign-based institutions, Japan now holds the greatest share at 4.5% of the U.S. national debt based on preliminary estimates, whose share is unchanged from a year earlier. China comes in second holding a share of 4.4%, which is down from 4.6% in 2021.
The international banking centers of Belgium, Ireland, and Luxembourg saw their share of the U.S. government’s total public debt outstanding held steady at 3.0%, while the United Kingdom saw its share increase from 1.5% to 2.1% over the past year. Brazil and the remaining foreign nations saw their shares of the U.S. national debt dip.
President Biden’s First Year in Office
As we noted, the national debt increased by $2.11 trillion in President Biden’s first year in office. That amount was inflated by President Biden’s American Rescue Plan Act, which we estimate accounts for $1.34 trillion or 63.5% of the increase by itself.
The following waterfall chart breaks down where most the money the U.S. government newly borrowed in President Biden’s first year in office came from:
We find the Federal Reserve loaned Uncle Sam 45% of all the net new borrowing. Foreign entities loaned the U.S. government the second largest amount at 33% of the net change, while U.S. individuals and institutions contributed the remaining 22%.

I think the most surprising part of the analysis is how much President Biden’s “American Rescue Plan” contributed to the nation’s indebtedness. That burden comes on top of its contributions to today’s inflation.


