


The End of Restaurants as We Know Them?
Since the start of 2024, numerous well-known restaurant chains have announced sizable closures and incrementally more drastic restructuring efforts. TGI Fridays has closed numerous locations across the US and sold eight corporate-owned locations to strengthen its franchise model and close underperforming stores. Denny’s shut down 57 restaurants in 2023 and announced additional closures for 2024 due to inflationary pressures. Boston Market drastically reduced its number of restaurants from around 300 to just 27 by March 2024, driven by landlord evictions, unpaid bills, and state shutdowns due to unpaid sales taxes. Mod Pizza abruptly closed 27 locations across the US, including five in California, just before the new minimum wage law took effect.
Also, suddenly, Coco’s Bakery and Carrows chains closed 75 locations, leading to a federal lawsuit by former employees due to the lack of notice provided for the layoffs. PDQ, a regional restaurant chain, closed eight restaurants across North and South Carolina in February 2024 due to market conditions. Outback Steakhouse’s parent company, Bloomin’ Brands, announced the shuttering of 41 locations of Outback Steakhouse, Carrabba’s Italian Grill and Bonefish Grill in February 2024 as part of a major financial restructuring. Subway has been undergoing a massive drawdown, closing over 400 underperforming locations since last year alone. Applebee’s has been selectively closing locations since the start of 2024, focusing on optimizing its restaurant portfolio by shutting down low-revenue stores.
In 2024, Buffalo Wild Wing will eliminate sixty locations in the United States. IHOP (International House of Pancakes) will wind down 100 locations. Other firms that are eliminating locations include Pizza Hut, Red Lobster, Hooters, and Chili’s. A handful of others may close down entirely.
COVID lockdowns significantly weakened chain restaurants by drastically reducing their customer base and revenue streams. This disruption made it difficult for many restaurants to sustain operations, some of which took on more debt in the face of depleted financial reserves. At the start of 2024, FSR (Full Service Restaurant) Magazine summarized:
Another after-shock of COVID was the debt pile. Going back to August 2020, the James Beard Foundation released survey data that suggested only 66 percent of independent bars and restaurants expected to survive the fall season without direct aid. Frothing to the top of this fear was the fact that close to 75 percent reported taking on new debt obligations north of $50,000. Moreso, 12 percent tagged the number at $500,000 and above. Growing debt, and the deterioration in operating performance required to service it, forced heightened levels of investor and debt-holder concern and oversight[.] … This increased debt between 2019 and the last 12 months 2020 by 8.1 percent for limited-service units and 15.7 percent for full-serves. The former, by the fall, sat at more than four times as much debt, while full service was at nearly 50 percent more than 2008 levels … [In] the current environment … 68 percent of full-service restaurants reported carrying some amount of debt. On average, it was $51,863.20—a number that could creep up as interest rates continue to rise.
“If debt is a piece of the profit puzzle, food costs are another. In fact, they appear to be an even bigger, more widespread concern … than the year before. This year, 58 percent of operators in the survey said rising inventory costs was their No. 1 source of financial strain, up from 54 percent in 2022.”
The total and annual percentage changes in the index prices of six key ingredients of restaurant and diner menu items from 2010 to 2020 and then from 2021 to the present are shown below; in most cases, over the last three years, prices have risen at multiples of their annual increases over the prior decade.
| CPI Beef & | CPI | CPI | CPI | CPI | CPI | |
| Veal | Chicken | Potatoes | Cheese | Lettuce | Bread | |
| 1/1/2010 | 213.17 | 130.511 | 296.827 | 202.749 | 293.926 | 158.917 |
| 12/1/2020 | 330.521 | 158.208 | 346.692 | 243.45 | 364.916 | 193.093 |
| Percent chg: | 55.05% | 21.22% | 16.80% | 20.07% | 24.15% | 21.51% |
| Annualized(10yrs): | 4.48% | 1.94% | 1.57% | 1.85% | 2.18% | 1.96% |
| 1/1/2021 | 333.526 | 157.889 | 370.458 | 244.437 | 350.892 | 191.579 |
| 5/1/2024 | 418.976 | 195.816 | 419.022 | 260.84 | 416.052 | 239.025 |
| Percent chg: | 25.62% | 24.02% | 13.11% | 6.71% | 18.57% | 24.77% |
| Annualized (~3yrs): | 7.90% | 7.42% | 4.19% | 2.19% | 5.83% | 7.63% |
Since January 2021, core CPI has risen just over 17 percent, while food-away-from-home prices have risen over 22 percent.
Core CPI (blue) vs. CPI Food Away From Home (black), 2014-2024
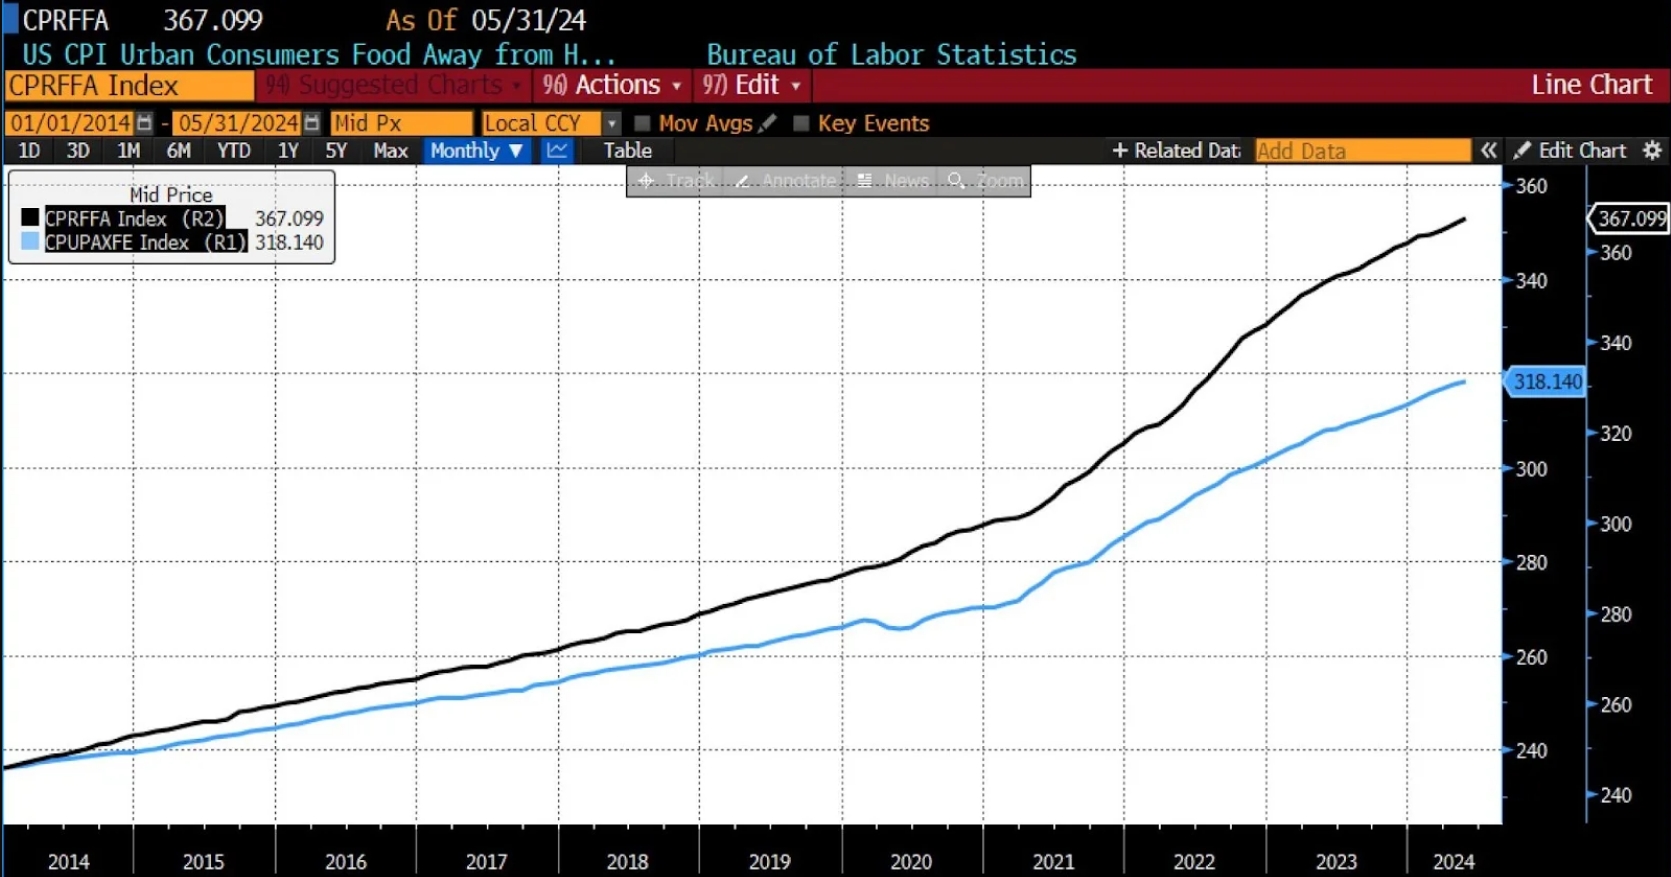 (Source: Bloomberg Finance, LP)
Those higher prices have translated into falling foot traffic. As costs of living have risen and pandemic savings have dissipated, eating outside the home has become more costly. Where meals continue to be purchased, order sizes are falling, or cheaper items are purchased. A small handful of massive firms with tremendous economies of scale are experimenting with lower priced options, but most eateries have cost structures that preclude similarly priced offerings. In fact, some franchisees of those huge restaurant chains are claiming that the depth of those discounts is financially untenable for them.
Recent data highlights a decline in restaurant visits, with several factors contributing to this trend. A report from Bar and Restaurant points out that many top revenue-generating restaurants experienced significant year-over-year declines in customer traffic in late 2023 and early 2024, with a further pronounced drop in January 2024. This decline is attributed to consumers curtailing their restaurant expenditures and opting for more cost-effective alternatives, such as cooking more meals at home due to high menu prices driven by inflation and wage increases. (This is also behind recently emerging controversies over tipping quantities and imperatives.)
Similarly, Produce Blue Book reports that same-store sales growth for restaurants was negative in February 2024, marking the worst-performing month since February 2021. Despite a slight improvement in sales growth compared to January, the data suggests that consumers are pulling back on restaurant visits and spending due to financial pressures such as growing credit card balances, high interest rates, and inflation. The expected slowdown in restaurant sales is attributed to these economic factors, which are leading consumers to moderate their restaurant consumption. Additionally, QSR Magazine notes that US traffic for limited-service chains fell by 3.5 percent year-over-year in the first quarter of 2024, further illustrating the challenges faced by the restaurant industry in attracting customers.
More recently, atop the compounded challenges of inflation and falling consumer demand are substantial jumps in state minimum wages. Since the start of 2024, more than half of all US states have, or planned to, to raise minimum wages:
| State | Previous MW | New MW | Percent Change | |
| 1 | Hawaii | $12.00 | $14.00 | 16.67% |
| 2 | Nebraska | $10.50 | $12.00 | 14.29% |
| 3 | Maryland | $13.25 | $15.00 | 13.21% |
| 4 | Delaware | $11.75 | $13.25 | 12.77% |
| 5 | Alaska | $10.85 | $11.73 | 8.11% |
| 6 | Illinois | $13.00 | $14.00 | 7.69% |
| 7 | Rhode Island | $13.00 | $14.00 | 7.69% |
| 8 | New York City, Westchester, Long Island | $15.00 | $16.00 | 6.67% |
| 9 | New Jersey (seasonal/small employers) | $12.93 | $13.75 | 6.34% |
| 10 | Colorado | $13.65 | $14.42 | 5.64% |
| 11 | New York | $14.20 | $15.00 | 5.63% |
| 12 | Connecticut | $15.00 | $15.69 | 4.60% |
| 13 | Vermont | $13.18 | $13.67 | 3.72% |
| 14 | South Dakota | $10.80 | $11.20 | 3.70% |
| 15 | Arizona | $13.85 | $14.35 | 3.61% |
| 16 | Montana | $9.95 | $10.30 | 3.52% |
| 17 | Ohio | $10.10 | $10.45 | 3.47% |
| 18 | Washington | $15.74 | $16.28 | 3.43% |
| 19 | California | $15.50 | $16.00* | 3.23% |
| 20 | Minnesota (small employers) | $8.63 | $8.85 | 2.55% |
| 21 | Maine | $13.80 | $14.15 | 2.54% |
| 22 | Missouri | $12.00 | $12.30 | 2.50% |
| 23 | Minnesota (large employers) | $10.59 | $10.85 | 2.46% |
| 24 | Michigan | $10.10 | $10.33 | 2.28% |
| High | 16.67% | |||
| Low | 2.28% | |||
| Average | 6.10% |
*California’s minimum wage, which rose to $16.00 on January 1st, increased again on April 1st, after which all fast food restaurant employees covered by the new law must be paid at least $20.00 per hour.
On July 1, Nevada and Oregon raised their minimum wages to $12 per hour while Washington, DC, increased theirs from $17 to $17.50 per hour for non-tipped workers and from $8 to $10 per hour for tipped workers. Florida’s minimum wage will rise to $13 per hour on September 30.
For traditional restaurants, profit margins are generally low, typically ranging between 3 to 5 percent, while in the fast food industry, profit margins are comparatively higher, generally lying between 5 and 8 percent. Estimating the impact of a minimum wage increase on the profitability of these establishments requires a nuanced understanding of their current profit margins and cost structures. Given these average profit margins, labor costs are a major expense, significantly affecting profitability. Any increase in the minimum wage substantially raises costs, squeezing the already narrow profit margins. For traditional restaurants with lower margins, even a small increase in labor costs could result in operations becoming unprofitable if prices aren’t adjusted accordingly or if cost-saving measures aren’t effectively implemented. Even before the substantial rise in wages and the slowing disinflation of the first quarter of 2024, food service industry strains were mounting.
According to the National Restaurant Association (NRA) Restaurant Business Conditions Survey, nearly all full-service restaurant owners—92 percent—consider rising food costs a significant challenge. Increased labor costs are not far behind at 90 percent, and 67 percent percent say utilities present a significant challenge. But they’re also spending more on the same things you’re spending more on—dishwasher detergent, hand soap, paper products, linens, laundry services, plates, silverware, and on and on.
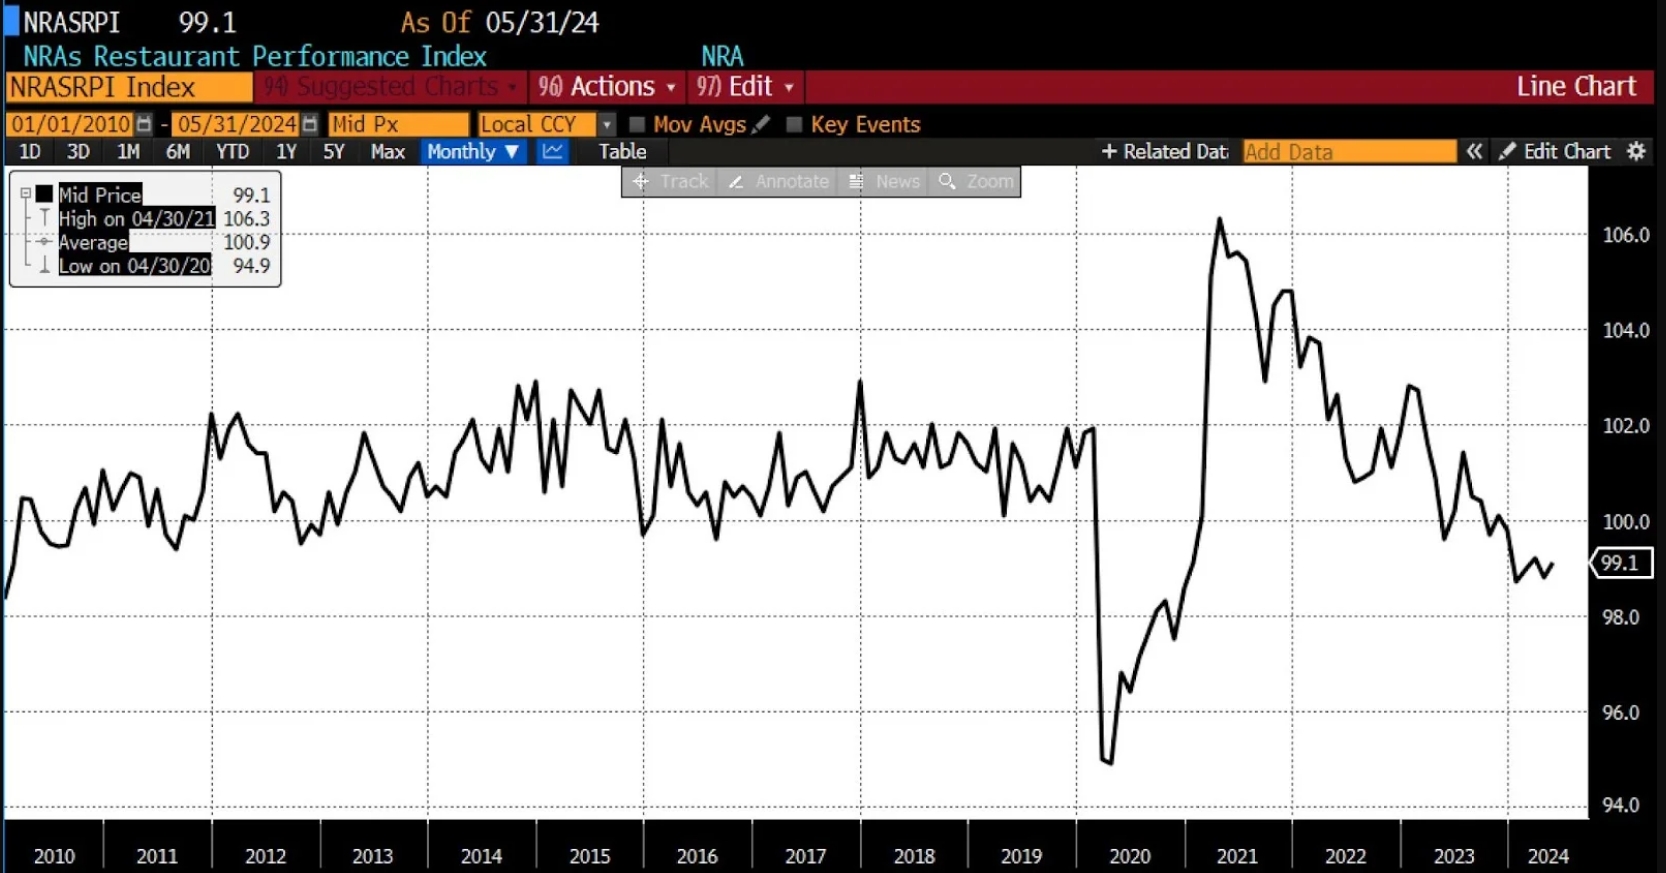
A little over two and a half years ago, I wrote about the breakdown of the NYC Pizza Principle as prices began to rise. Restaurants nationwide are now grappling with a financial maelstrom, including rising prices, higher minimum wages, falling sales, and, in many cases, higher debt costs. The health of the industry is summed up by comparing the stability of the National Restaurant Association Performance Index from 2010 through the pandemic with its trajectory since 2021, as the general price level hit four—decade highs and remains elevated to this day.
National Restaurant Association Restaurant Performance Index, 2010-present
 (Source: Bloomberg Finance, LP)
The cumulative impact of these pressures is straining the industry from single-location establishments to nationwide and international chains. If accelerating US unemployment registers the impact of contractionary monetary policy measures on the broader economy, the current difficulties faced by the restaurant sector are likely to escalate. And insofar as those economic conditions persist, all but the stoutest and most well-capitalized food service industry interests may find it increasingly challenging to serve customers, the impact of which will be felt by employees, investors, and peripheral businesses alike.
This article was originally featured on AIER.org. You can read the original here.


