Breaking Down the National Debt
The U.S. government’s 2022 fiscal year ended on September 30, 2022. At that time, the nation’s total public debt outstanding totaled $30.93 trillion. That’s the equivalent of $238,051 of debt for each American household, or $93,192 for each individual American.
Who does the U.S. government owe all that money to?
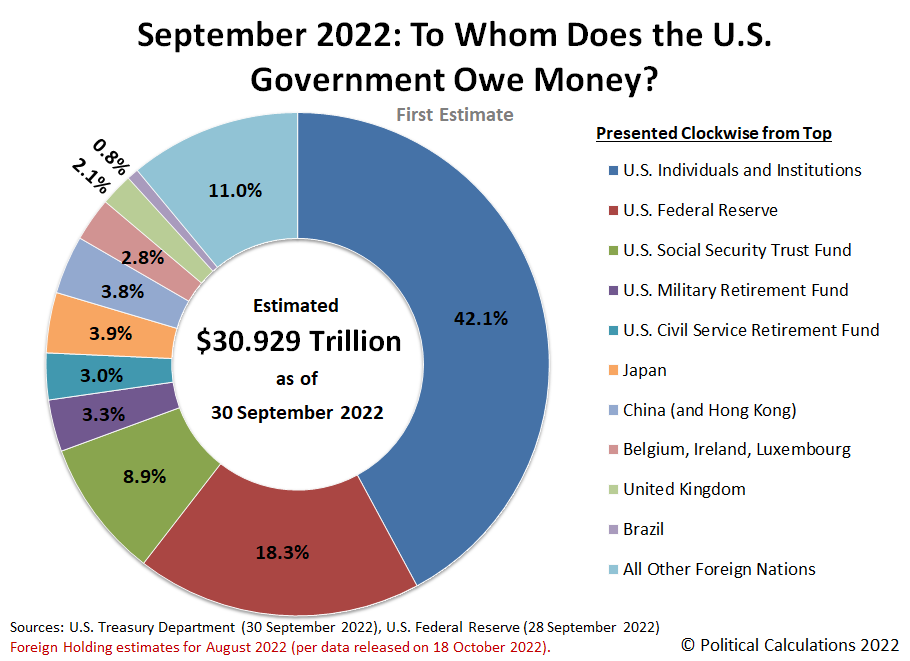
The answer is illustrated in the chart below:
Political Calculations provides some analysis:
The Overall Picture
The U.S. Federal Reserve is once again Uncle Sam’s single largest creditor, accounting for 18.3% of the entire U.S. government’s national debt. The Fed’s share of the total public debt outstanding has decreased from 19.1% a year ago, mainly as the Federal Reserve has all but stopped underwriting the U.S. government’s new spending. Instead, since March 2022, the Federal Reserve has been hiking interest rates in a campaign to slow the rise of inflation that was unleashed by President Biden’s spending.
With the Fed having raised interest rates above the near-zero level they were at when President Biden was sworn into office, U.S. individuals and institutions (banks, insurance companies, pension funds, etc.) have picked up most of the slack now that loaning money to Uncle Sam has become more worthwhile with higher interest rates. The share owned by this category of major national debt holders has increased from 37.7% to 42.1%.
Meanwhile, the share of the U.S. government’s national debt owed to Social Security has continued falling from 9.2% to 8.9%. That’s because Social Security has been running in the red since 2009, forcing its Old Age and Survivors’ Insurance Trust Fund to sell off U.S. treasuries it accumulated when it was operating in the black so it can keep paying out benefits at promised levels. Social Security’s share of the U.S. national debt is projected to decline to 0% in 2034. After that happens, Social Security benefits will be reduced by somewhere between 20-25% as promised under current law.
The retirement trust funds for the U.S. government’s military and civilian employees together account for 6.6% of the total U.S. national debt, down from 7.1% in 2021.
Foreign entities collectively hold 24.3% of the total debt liabilities issued by the U.S. government, down from the share of 26.6% they held at the end of the U.S. government’s 2021 fiscal year. Of the portion of the national debt owed to foreign-based institutions, Japan continues to hold the greatest share at 3.9% of the U.S. national debt based on preliminary estimates, down from its 2021 share of 4.6%. China comes in second holding a share of 3.8%, falling from a share of 4.6% in 2021. Both countries have been selling off their holdings of U.S. government-issued debt securities to keep their currencies from losing too much value with respect to the U.S. dollar.
President Biden’s Debt Contribution
Political Calculations also summarized how much President Biden’s policies have contributed to the national debt:
When Joe Biden was sworn in as President of the United States on 20 January 2021, the U.S. national debt stood at $27.76 trillion. Just over eight months later, at the end of the U.S. government’s 2021 fiscal year, the U.S. government’s total public debt outstanding had risen to $28.43 trillion.
And now, one year after that, the U.S. national debt has risen to $30.93 trillion through the end of the U.S. government’s 2022 fiscal year. That’s an increase of $2.5 trillion over the past year and an increase of $3.17 trillion during President Biden’s tenure in office.
The $3.17 trillion of new debt divided among 129.93 million households works out to an equal share of $24,398 for each. Or $9,551 for each American. That’s important because guess who will pay all that money back to Uncle Sam’s many creditors?


