Illustrating Obamacare’s Effect on Employers’ Health Costs
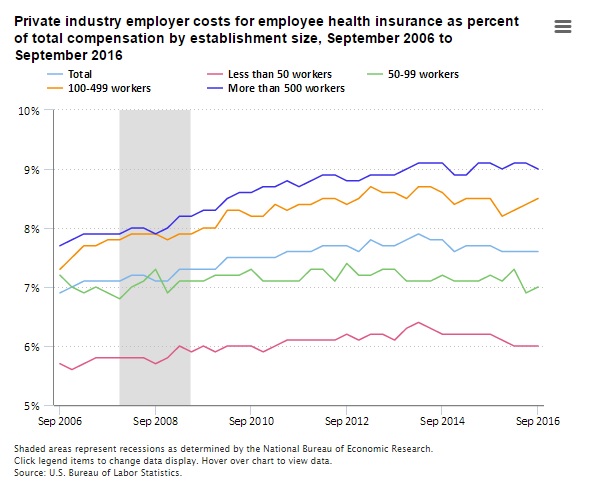
The Bureau of Labor Statistics has published a chart showing how health-benefit costs among private employers have increased over the past decade. The chart shows health benefits increased from 6.9 percent of total compensation in September 2006 to 7.6 percent last September. The 0.7 percentage point absolute increase is a relative increase of ten percent.

The chart shades the period of the Great Recession (December 2007 through June 2009), after which health benefits as a share of total compensation really jump. This increase is counter-intuitive, because health benefits are stickier than wages, so they would normally have shrunk as a share of total compensation as wages caught up.
President Obama signed the Affordable Care Act in March 2010. It is hard to determine the ACA’s effect at any single point after that date, because its regulations dripped out over the years. The exchanges, which heavily subsidized individual health insurance, began providing coverage in January 2014. The establishment of exchanges would have encouraged employers to “dump” their employees into them.
The law inhibited such behavior through a mandate on employers of 50 or more workers to offer “affordable” health coverage. However, the Obama administration delayed enforcement of this mandate until 2015 for employers with 100 or more workers, and until 2016 for employers with 50 to 99 workers. Employers of fewer than 50 workers do not bear the mandate.
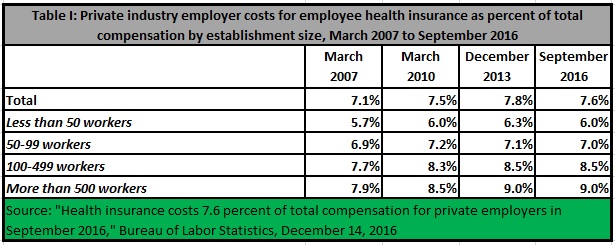
Table I (derived from the same Bureau of Labor Statistics report with the chart above) breaks down health benefits as a share of total compensation among employers of various sizes, at certain inflection points: A baseline measurement exactly four years before Obamacare was signed, the month Obamacare was signed, the month before exchange coverage began, and the latest measurement.

For small businesses that do not bear the employer mandate, health benefits as a share of total compensation climbed at a steady rate until the exchanges opened for business. Then they dropped from 6.3 percent to 6.0 percent, a relative decline of almost five percent. This decrease suggests that small businesses have had some success in socializing their employees’ health costs by sending them to the exchanges for subsidized coverage.
Overall, Obamacare appears to have increased employers’ costs, but not catastrophically. The report notes: “Private industry employer costs for health insurance have not been lower than the current 7.6 percent of total compensation since March 2011, having reached a peak of 7.9 percent of total compensation in March 2014.”
However, other sources note that total health costs have increased even more, because employers have shifted a greater share of premium to employees. According to the Kaiser Family Foundation (which includes government and private employers in its survey), premiums have increased 58 percent from 2006 to 2016. Workers’ share increased 78 percent, while employers’ share increased just 51 percent.
In itself, this difference is not a problem, because it is a myth that employers bear any share of employees’ wages. Employees bear all the cost of their employers’ share of health benefits through foregone wages. Nevertheless, Obamacare’s failure to achieve its goal of reducing health costs is increasingly obvious from the administration’s own agencies’ data.
* * *
For the pivotal alternative to Obamacare, see Priceless: Curing the Healthcare Crisis and A Better Choice: Healthcare Solutions for America, by John C. Goodman, published by Independent Institute.


