


The National Debt and the Control of the House
Under the U.S. Constitution, all bills for raising revenue that determine how much Americans will be taxed must originate in the U.S. House of Representatives. By tradition, all appropriation bills that determine how much the U.S. government may spend also originate in the House of Representatives.
That combination of taxing and spending power goes a long way in explaining why the U.S. government’s total public debt outstanding now totals in the tens of trillions of dollars, where over the years, the U.S. government has appropriated far more spending than it has proved capable of collecting in taxes.
Since all the taxing and spending that has produced today’s multi-trillion dollar national debt is the result of appropriations and tax bills that started life in the U.S. House of Representatives, I thought it might be interesting to consider the track record of the party that controls the House in contributing to the growth of the nation’s total public debt outstanding in the modern era.
The following chart presents the average annual change in the national debt over the periods in which the indicated political party controlled the U.S. House of Representatives – Democrats from 1955 through 1994, Republicans from 1995 through 2006, Democrats from 2007 through 2010, Republicans from 2011 through 2018, where the figure shown corresponds to the amount of the national debt accumulated through November 6, 2018. Following the mid-term election, the Democrats are set to assume control of the House once more in 2019.
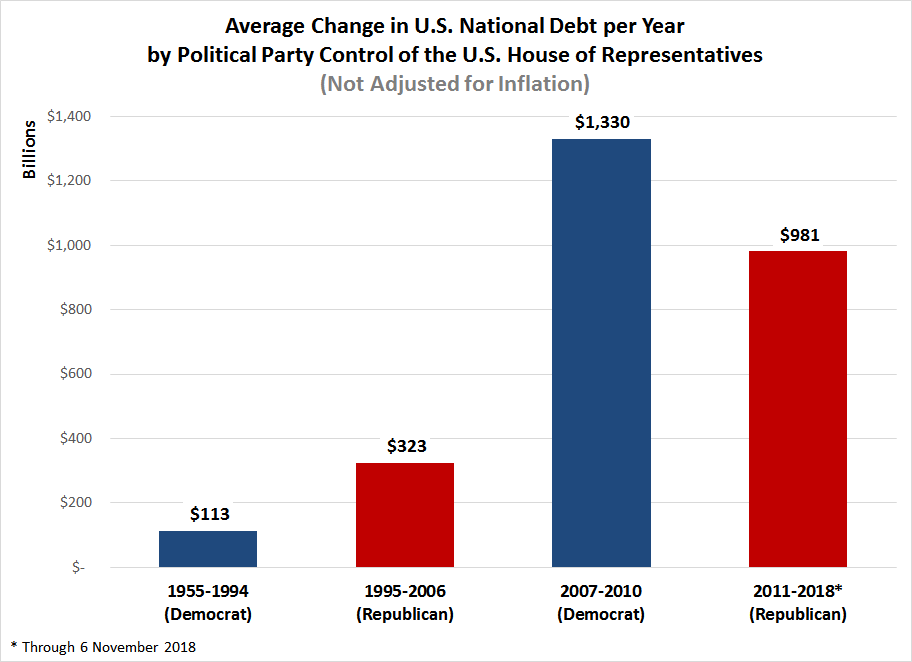
These figures are all based on the nominal recorded level of the national debt on January 3 of the years in which the indicated political party assumed control of the U.S. House of Representatives. As such, they haven’t been adjusted to account for inflation, which has been done in the next chart, where all the dollar amounts have been expressed in terms of constant October 2018 U.S. dollars.
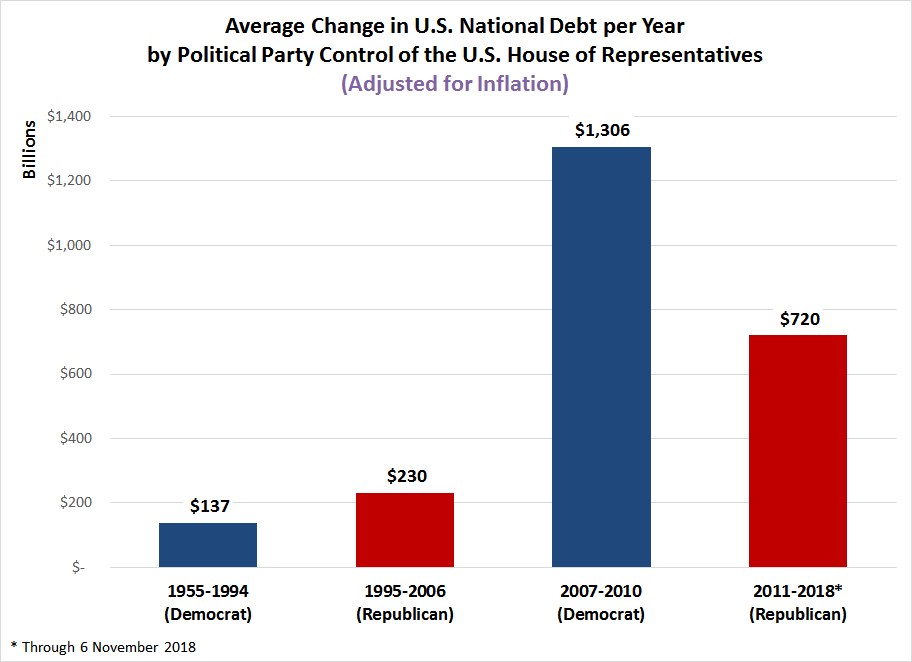
This second chart is particularly scary, especially from a national security perspective, when you realize that many of the members of the Democrat party’s leadership team that were directly responsible for the out-of-control increases in the national debt from 2007 through 2010 will return to the same seats of power they held during that time in the upcoming Congress.


