


What Is Your State’s Fiscal Health Ranking?
It’s ranking season for comparing the relative health of individual U.S. states! After covering how your state ranks on personal income taxes, it’s now time to dig deeper into your state’s fiscal health, which we can do with the 2018 edition of the Mercatus Center’s State Fiscal Condition Rankings, which were just published earlier this month.
Conducted by Eileen Norcross and Olivia Gonzalez, the 2018 study measures how well state governments within the U.S. are able to meet their short and long-term obligations based on their financial statements. Norcross and Gonzalez paid close attention to the following five measures of fiscal stability, which they combined to produce an overall ranking for the solvency of state governments.
- Cash solvency. Does a state have enough cash on hand to cover its short-term bills?
- Budget solvency. Can a state cover its fiscal year spending with revenues, or does it have a budget short-fall?
- Long-run solvency. Can a state meet its long-term spending commitments? Will there be enough money to cushion it from economic shocks or other long-term fiscal risks?
- Service-level solvency. How large a percentage of personal income are taxes, revenue, and spending? How much “fiscal slack” does a state have to increase spending if citizens demand more services?
- Trust fund solvency. How much debt does a state have? How large are its unfunded pension and healthcare liabilities?
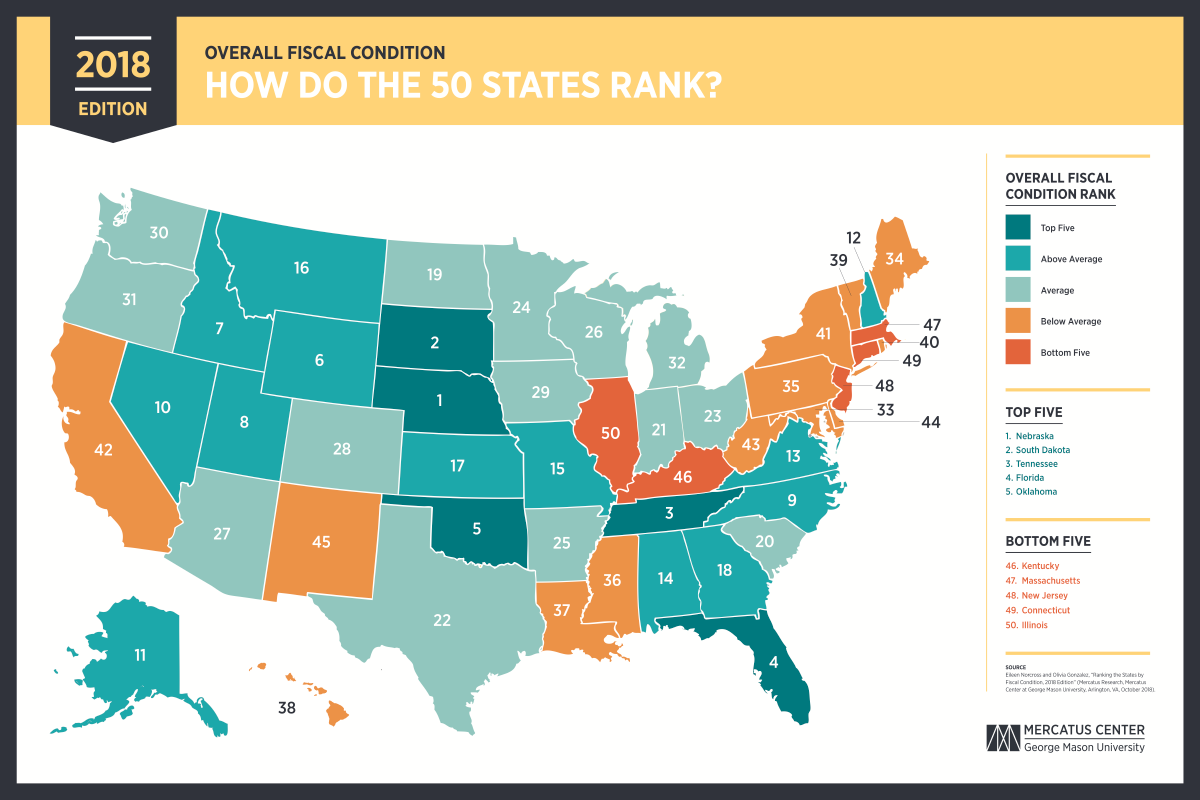
The following map illustrates their results, emphasizing the Top 5 states (Nebraska, South Dakota, Tennessee, Florida, and Oklahoma) and the Bottom 5 states (Kentucky, Massachusetts, New Jersey, Connecticut, and Illinois) in the rankings.
Norcross and Gonzalez have a number of key takeaways from their analysis.
- Consistent performers. Some states have consistently performed poorly, such as Connecticut, Illinois, and New Jersey. They have experienced ongoing structural deficits, a growing reliance on debt to fund spending, underfunded pensions and other postemployment benefit liabilities, or some combination of these problems. States with low levels of debt and unfunded pension liabilities and strong short-term indicators include Nebraska, Tennessee, and Utah.
- Fiscal implications of heavy reliance on oil tax revenue. Alaska, North Dakota, and Wyoming rely heavily on severance taxes on oil production as sources of revenue to finance government spending. These states experience volatility in their short-term solvency and dramatic swings in cash and revenue levels. In some cases this leads them to increase spending beyond a level that could be supported if the revenues were raised based on the income of residents.
- Fiscal implications of major tax reform. Indiana, Kansas, Michigan, North Carolina, Rhode Island, and Utah have each passed a variety of tax reforms during the time period this study analyzes. In the cases of Indiana and North Carolina, these reforms were accompanied by base-broadening or spending reforms that resulted in neutral or positive impacts on the states’ financial positions. By contrast, Kansas’s tax reform of 2012 cut rates but narrowed the tax base by including an income tax exemption for sole proprietorships. It also did not undertake spending reforms. This led to a steady decline in Kansas’s budget solvency during the postreform years.
The Mercatus Center’s 2018 report ranking the fiscal solvency of state governments in the U.S. is the fifth and final report of its series. If I were to consolidate what we’ve learned over the past five years from their work into one policy statement for state policy wonks, it’s this: “Stop doing stupid things.”
Sound fiscal management is all about addressing the challenges you have without making your money problems worse. That mostly means taking positive steps to restrain the growth of state government spending, which elected officials can completely control, so that it can weather the volatility of the state’s sources of revenue, which it cannot control. In practice, that generally means keeping the average growth rate of state government spending below the average growth rate of the state’s economy over time.
The states that consistently rank in the bottom of the fiscal solvency rankings are those where state officials have largely abdicated their responsibilities in adhering to this simple practice, where politicians gain perverse benefits from the situation.
The good news is that these problems are solvable by implementing sound fiscal reforms and enforcing laws to prevent perverse gains from political dysfunction from enjoyed by those who seek them. For the states that have consistently been at the bottom of the state fiscal solvency rankings, the sooner that happens, the better.


