


The Fiscal Impact of President Trump’s Tax Cuts
When the U.S. Congress passed tax cuts in December 2017, there were two main schools of thought about their impact on the U.S. government’s fiscal situation:
- The tax cuts would stimulate faster economic growth such that the tax cuts would pay for themselves.
- The tax cuts would “explode” the U.S. government’s budget deficit.
These are two diametrically opposing arguments that have been voiced by some of the most partisan politicians and media organizations in Washington D.C. As you might imagine, in the real world beyond the Beltway, in the first six months after the Tax Cuts and Jobs Act of 2017 was signed into law the true answer is falling somewhere in between.
The following chart shows how much revenue that the U.S. government has collected in each month of its fiscal years from 2015 through the first nine months of its 2018 fiscal year. Since the federal government’s fiscal year begins on October 1 of the preceding calendar year, the months shown in the chart run from October through September to coincide with that odd timing.
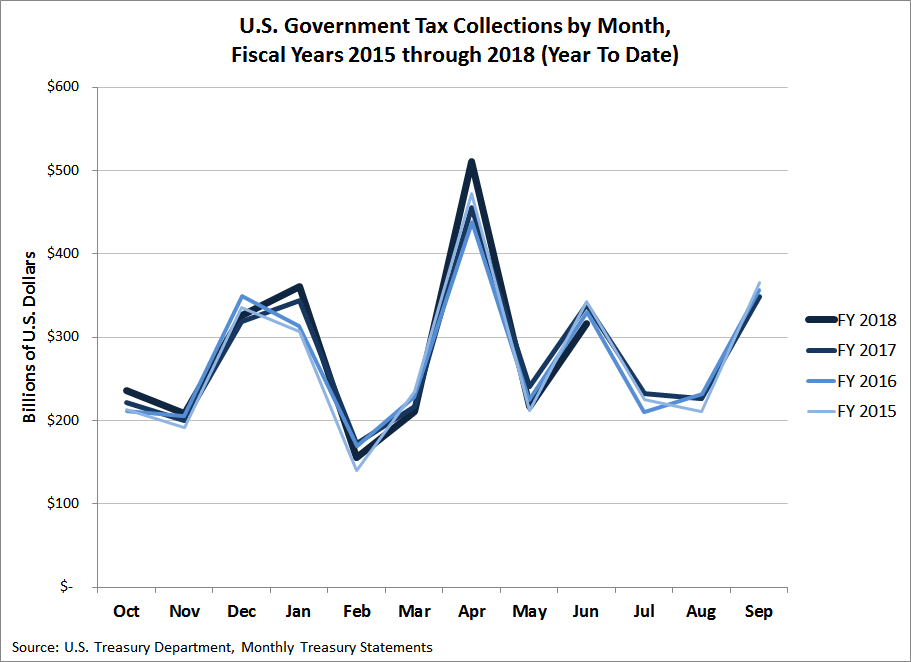
We can measure the fiscal impact of President Trump’s tax cuts by comparing the monthly tax collections for the 2018 fiscal year against the three previous years. A quick visual inspection of the chart reveals that:
- The U.S. government had higher tax collections in FY2018 than previous fiscal years for the months of October 2017, January 2018, and April 2018.
- The U.S. government had lower tax collections in FY2018 than previous fiscal years for the months of March 2018 and June 2018.
- The U.S. government had similar tax collections in FY 2018 with respect to previous fiscal years for the months of November 2017, December 2017, February 2018, and May 2018.
Because the tax cuts weren’t fully implemented for income tax withholding until mid-February 2018, the tax collections for the months of October 2017 through January 2018 should be excluded from consideration for measuring the fiscal impact of President Trump’s tax cuts.
The same principle holds true for the tax collections of April 2018 which, because the amount of taxes that the government collects during this month is boosted by the annual filing of personal income tax returns for the previous calendar year, actually represents the contributions of taxes that were assessed under the tax laws that applied before the Tax Cuts and Jobs Act of 2017 went into effect.
After excluding April 2018 for that reason, we see that for the months of February 2018 through June 2018, the U.S. government’s monthly tax revenues have either been similar to the tax collections of the three previous fiscal years or have fallen within several percentage points below those levels.
That combination confirms two things. First, the Trump tax cuts are not fully paying for themselves through faster economic growth during the first months that they have been in effect. Second, although they are contributing to higher deficits, they are not “exploding” them. For the months since they have been in effect, they have contributed anywhere from $29 billion to $68 billion in higher deficits when compared to revenues collected during the same months in previous fiscal years.
If you want to see what has really contributed to exploding deficits in the current fiscal year, spending increases have added anywhere from $31 billion to $338 billion over the same months. So, we can do an apples-to-apples comparison with previous fiscal years for when the Tax Cuts and Jobs Act has been in effect.
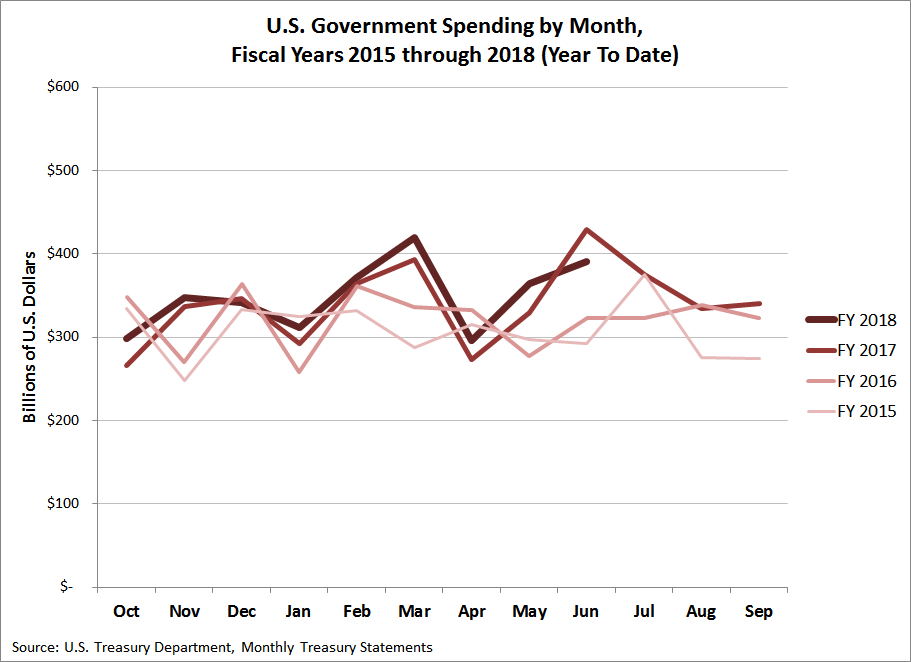
We keep coming back to the same point. It’s the spending, stupid!


